The report that is being generated will have the top 10 "Sales Rep Name" who have made the most business in the current year.
The other part to this report is that, we want to compare their performance to the previous years business that these top 10 "Sales Reps" have brought in.
We would also like to compare their ranks in the previous year.
- So first lets create a fact measure "Year Ago Revenue" which we can use to show in our report as below in the 5th column.
- Open the Administration Tool, then select the blue "Open Online" folder. Enter the Repository Password (BISAMPLE1) and the weblogic administrator's Password (e.g. Administrator1)

- Under the "Business Model and Mapping" Layer, right click the "F1 Revenue" and select "New Object" -> "Logical Column..."

- In the "Logical Column" Window give for Name: Year Ago Revenue as seen below:

- Goto the "Column Source" Tab and select "Derived from existing columns using an expression" radio button then click on the "Edit Expression" icon.
- Enter the following expression in the "Expression Builder" Window by selecting "Functions" in the "Category:" list, "Time Series Functions" in the "Functions:" list then "Ago" "Time Series Functions:" section.
- Select the "<<Measure>>" in the "Ago( )" function, then select "Logical Tables" in the "Category:" list, "F1 Revenue" in the "Logical Tables:" list, then double click the "Revenue" in the "Columns:" list.
- Select the "<<Level>>" in the "Ago( )" function, then select "Time Dimensions" in the "Category" list, "H1 Time" in the "Time Dimensions:" list, then double click the "Year" in the "H1 Time:" list.
- Select the "<<Number of Periods>>" and enter 1.
- Make sure the below expression is created in the right text box: Ago("Sample Sales"."F1 Revenue"."Revenue" , "Sample Sales"."H1 Time"."Year" , 1)

- Click OK to close the expression builder and OK again in the "Logical Column - Year Ago Revenue" window so the new logical column can be seen.
- Drag the "Year Ago Revenue" from the BMM layer to the Presentation layer as show below:

- In order to show the "Revenue Rank" at the Year level and NOT the combined years level.
- Double click the "Revenue Rank" measure under the "F1 Revenue" Fact table in the Business Model and Mapping layer and make sure the Rank("Sample Sales"."F1 Revenue"."Revenue" expression shows in the "Derived from existing columns using an expression" box.

- Click the "Levels" tab and and change the "Logical Level" for the "H1 Time" to "Year".
- Click OK to close the "Logical Column" window for the "Revenue Rank".

- Now save the changes with File -> Save and click OK to test the global consistency and check in the changes to the online repository.
- Now goto your Enterprise Manager Console and restart your BI services by clicking on the Restart button for your "Business Intelligence" -> coreapplication instance

- Now go back to your https://localhost:9704/analytics answers web page and create a report with the following columns:
"Per Name Year", "Sales Rep Name", Revenue, Revenue, "Year Ago Revenue", "Revenue Rank".
Select the "Per Name Year" options and choose the Sort -> "Sort Descending" to sort this column values in the descending order.
Select the 4th "Revenue" Column options and select the "Edit formula" option to open the "Edit Column Forumla" window.
Select the "f(...)" and select Rank function under the Functions -> Aggregate section and click OK to close the window.

- Now select the 6th "Year Ago Revenue" Column options and select the "Edit formula" to open the "Edit Column Formula" window.
- Select the "f(...)" button the Rank function under the Functions -> Aggregate section.
- Click OK to close the "Edit Column Formula" window.
- Select the 4th "Revenue" column options and select Sort -> "Sort Ascending". Note this is the second sorted column after the first "Per Year Name".
- The below screenshot shows the final modified columns :

- Click the Results tab to see the below results:

- Click the Save Icon to save the newly created analysis under a new folder "Sample Sales" under the "Shared Folders" as show below:
- Name the file: "Top 10 Sales Rep and Rank"

Our Next task is to get the top 10 "Sales Rep Name" entries instead of all the member rows.
- Now go back to the "Criteria" Tab and select the 4th "RANK(Revenue)" Column options and select "Edit formula".
- In the "Edit Column Formula" Window select the "Custom Headings" checkbox and enter "OVERALL RANK(Revenue)" next to the "Column Heading".
- Click OK to close the "Edit Column Formula" window.

- Select the Results tab and expand the "Selection Steps" section by clicking on the "+" next to it.
- Under the "Sales Rep - Sales Rep Name" section, click the "2. Then, New Step..." link -> "Apply a Condition" to open the "New Condition Step" window.
- Select the "Condition Type" as "Top 10 based on X,
- For "Action" select "Keep only".
- For "Operator" select "is top".
- For "Rank" enter 10 and make sure the % checkbox is de-selected.
- For "Measure" select "Base Facts"."Revenue" field.
- Click OK to create the new step.

- You should now be able to see only the top 10 Sales Reps for each ear.
- Notice that "RANK(Revenue)" is the rank over all years and "Revenue Rank" is a rank on a year wise basis.

Our Next task is to setup a Presentation variable so the user can select which years to report on.
- Goto the "Catalog" Tab and Edit under the "Top 10 Sales Rep and Rank" report.
- After you get the report select the Prompts tab:
- In the page click the Green addition symbol to add a new prompt, then select "column prompt" -> "Time"."Per Name Year"
- In the "New Prompt:" window let there be defaults and
- Select "* Prompt User" for the "Operator" option.
Select "Choice List" for the "User Input" option.
Select the checkbox for "Include *All Column Values* choice in the list"
Select the checkbox for "Enable user to select multiple values".
Select the checkbox for "Require user input" option.
For the "Set a variable" select "Presentation Variable" and enter "YearData" as show below:

- Click OK and save the analysis by clicking on the save icon.

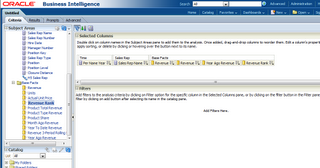
- Select the "Criteria" Tab and select the "Per Name Year" options and select "Filter".
- In the "New Filter" window select the "Add More Options" -> "Presentation Variable".
- For the "Variable Expr" enter "YearData" and the for the "Default" enter "2010".
- Click OK to close the "New Filter" window.

- Now the Filters section should like the below:

- Click the "Results" Tab then the "Show how the results will look on a Dashboard icon
 to view the results with the new created prompt.
Select the 2009 and 2010 checkboxes and click on the white space are to see the OK button.

- Click the OK button to see your results with the user selected year values:


Summary:
As you can see we have a "Year Ago Revenue" measure in our RPD to view the "Sales Reps" previous year business revenue and rank to compare with current year business and rank.
Then we created "Selection Step" criteria to only get the top 10 "Sales Reps"
Then we created a pompt on "Per Name Year" which updates a presentation variable which can be used for your "Per Name Year" filter.
No comments:
Post a Comment