The general requirement asked for by customers is that they want to Click on the Main Dashboard Page's Graph and be transferred to the other Dashboard Page or Tab on the Same Dashboard.
I will be creating 2 Dashboard Pages(Sales, Sales Details) and the first page(Sales) will contain a graph which will have clickable links to move to the second page(Sales Details) which will have "is prompted" prompts to display the table of the graph region where the user has clicked on.
- Start by opening the URL: http://localhost:9704/analytics and login using the administrator user "weblogic"
First I will be creating the report for the second "Sales Details" page.
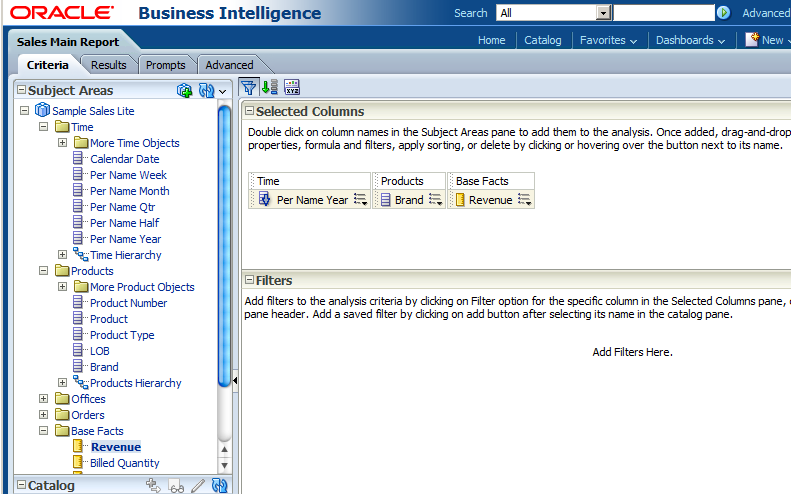
On the main "Oracle BI Answers" menu select "New" -> "Analysis" -> "Sample Sales Lite" and select the columns as show below.
Then click the "Save Analysis" icon to save the report under the folder "Shared Folders" -> "11g Shared" and enter "Sales Detail Report" for "Name" field.

- Click the "OK" button on the "Save As" window to close it.
- Select the "Per Name Year" options and select "Filter" and select "is prompted" for the "Operator" field as show below:

- Click the "OK" button to close the "New Filter" window.
- Select the "Brand" options and select "Filter" and select "is prompted" for the "Operator" field as show below:

- Click the "OK" button to close the "New Filter" window.
- Make sure all the "is prompted" filters are created as below:

- Click the "Save Analysis" icon to save the changes.
- Now onto create a "Dashboard Prompt" for your "Sales Details" dashboard page.
- On the main "Oracle BI Answers" menu select "New" -> "Dashboard Prompt" -> "Samples Sales Lite" and create the following prompts as below:
- Click on the "+" icon then select "Column Prompt..." .
- In the "Select Column" window select "Sample Sales Lite" -> "Time" -> "Pre Name Year" and click the "OK" button.
- In the "New Prompt: Per Name Year" window check the "Require User Input" checkbox.
- Select "Specific Values" option for the "Default selection", click on the "+" icon and select "2009" and "2010" for the values.

- Click "OK" button on the "Select Values" window.
- Leave the other defaults in the "New Prompt : Per Name Year" window and click "OK" button.
- Create a similar prompt for the "Brand" column as shown below:

- Make sure the two prompts area created as shown in above screenshots and the final "Definition" screen is as show below:

- Click the "Save Prompt" icon on the top right corner and Save it with the name "Sales Prompt" under "Shared Folders" -> "11g Shared" as show below:

- Now onto creating the Graph to put into our first dashboard(Sales).
- On the main "Oracle BI Answers" menu select "New" -> "Analysis" -> "Sample Sales Lite" and select the columns as shown below.
- Select the "Per Name Year" column options and select "Sort" -> "Sort Descending"

- Click the "Save Analysis" icon and browse to "Shared Folders" -> "11g Shared" then enter "Sales Main Report" for the "Name"

- Click "OK" button to close the "Save As" window.
- Goto the "Results" tab and click on the "New View" icon
 then select "Graph" -> "Bar" -> "Vertical".
 - Once the Graph shows up, drag the "Graph" box above the "Table" box by clicking on the "Graph" Title bar and dragging it as show below:

- Click the "Edit View" on the "Graph" title bar.
- In the "Layout" section drag the "Brand" column to the "Vary Color By (Horizontal Axis)" section.
- Check the "Show in Legend" checkbox.
- Click on the "Edit Graph Properties" on the "Graph" window menu.
- Click on the "Style" tab.
- Select "Rectangle" for the Style field.
- For "Plot Area" "Background" enter "#6699CC".
- Select the "Specify" for "Gridlines"
- For the "Major Grid" enter "#000000".
- For the "Minor Grid" enter "#0000FF".
- Leave the other defaults and click the "OK" button to close the "Graph properties" window.

- Click "Done" button above the "Graph" menu.
- Click on the "Remove view From Compound Layout" i.e "X" button on the "Table" Title bar.
- Click on the "Save Analysis" icon to save the changes.
- On the main "Oracle BI Answers" menu select "New" -> "Dashboard" and enter "Sales" for the Name, then click "OK" button.
- Drag the "Sales Main Report" from "Catalog" bottom left pane to the right "Drop Content Here" pane.
- Click on the "Save" icon.

- Click the "Run" button to test your dashboard.
- On the "Sales" dashboard select "Page Options" on the top right and select "Edit Dashboard"
- Click on the "Add Dashboard Page" i.e. "+" icon to add a new page.
- Enter the page name as "Sales Details" and click the "OK" button.
- Drag the "Sales Detail Report" from the bottom left "Catalog" Pane to the right "Drop Content Here" pane.
- Then Drag the "Sales Detail Report" from the "Catalog" pane to under the "Section 1" "Sales Prompt" box as show below:

- Click the "Save" icon to save the Dashboard.
- Then click the "Run" icon to test that your second page is working.
- Now onto linking both our pages, so if we select something on the Graph on "Page 1" we come to details on "Sales Details" page.
- Go to the "Catalog" on the main menu and select "Shared Folders" -> "11g Shared" folder on the left "Folders" pane.
- Select "Edit" link on the "Sales Main Report".
- Click on the "Criteria" tab and select "Revenue" options "Column Properties", then on the "Interaction" tab.
- Click on the "+" icon to add a "New Action Link ...".
- Select the first gear icon "Create New Action" then the "Navigate to BI Content".
- In the "Select BI Content For Action" window, goto the "Shared Folders" -> "11g Shared" -> "Dashboards" -> "Sales" and select the "Sales Details" page.

- Click "OK" button and again "OK" button for the "Create New Action" window.
- Enter "Get Details" for the "Link Text" on the "New Action Link" window.
- Click the "OK" button and verify as below:

- Click "OK" to close the "Column Properties" window.
- Click on the "Save Analysis" icon to save your changes.
- Now on to test our "Sales" Dashboard.
- On the Answers main menu select "Dashboard" -> "Sales"

- You should now see your main Dashboard page as below, select the "2010", "BizTech" blue bar to show the "Get Details" popup.

- Click on the "Get Details".
- Now you should see the control taken to the "Sales Details" page on your "Sales" Dashboard, showing the "2010" and "BizTech" table as show below:


Summary:
I have shown how to create an Action Link or Traversing link from the Sales Graph to the Related Sales Details Table.
By playing with options in your "Navigation" tab as show above you should be able to create much more interactive reports.
No comments:
Post a Comment