Here we will observe how to format data and add tool tips on column headers and column data.
- Open the URL: http://localhost:9704/analytics and login as administrator user "webogic".
- Select "New" -> "Analysis" -> "Sample Sales" to start with your new report.
- Select the 3 columns from the left "Subject Areas" pane: "Per Name Month" and "Revenue" as show below.
- Then on the 3rd "Revenue" column select options "Edit Formula"

- In the "Edit Column Formula" window select the "Custom Headings" checkbox and enter "Revenue D" in the "Column Heading" field and click the "OK" button.

- Select the 3rd "Revenue D" column options and select "Column Properties".
- In the "Column Properties" window select the "Conditional Format" tab.
- Select the "Add Condition >" then the "Revenue D".
- In the "New Condition" window select "is less than or equal to" for the "Operator" field and "700000" for the "Value" column and click the "OK" button.
- In the "Edit Format" window under the "Cell" section select the "Background Color".
- In the "Color Selector" window enter "#FFCC99" and click the "OK" button.

- Next select the "Data Format" tab and check the "Override Default Data Format" checkbox.
- then enter as per below show screenshot:

- Create another similar condition bye selecting the "Add Condition >" -> "Revenue D".
- Enter "is greater than" for the "Operator" and "700000" for the "Value".
- Select the "Style" tab and click on the "Background Color" under the "Cell" section and enter "#CCFFFF" and click "OK" to close the "Color Selector" window.
- On the "Data Format" tab enter the same values as mentioned in previous steps.
- Make sure your entries confirm to the below screenshot and click the "OK" button.

- Go back to the "Selected Columns" screen and select the 2nd "Revenue" column options "Edit formula"
- Select the "Column Headings" and "Contains HTML Markup" checkboxes and enter below text for the "Column Heading" field:
- <div title="This Column Shows the Total Sales">Revenue</div>
- In the "Column Formula" enter the below text:
- CASE WHEN "Base Facts"."Revenue" > 700000 THEN '<div title="Very Good Sales Revenue" style="background: #ccffff;text-align: right">' || '$' || CAST("Base Facts"."Revenue" AS VARCHAR(40)) || '</div>' ELSE '<div title="Not So Good Sales Revenue" style="background: #ffcc99;text-align: right">' || '$' || CAST("Base Facts"."Revenue" AS VARCHAR(40)) || '</div>' END

- Click "OK" button to close the "Edit Column Formula" window.
- Select the 2nd "Revenue" column options "Column Properties".
- Then select the "Data Format" tab.
- Check the "Override Default Data Format" checkbox.
- Select the "HTML" for the "Treat Text As" field and click the "OK" button.

- Click the "Save Analysis" icon on the top right to save the analysis and enter "Custom Rev Sales" for the "Name" field.
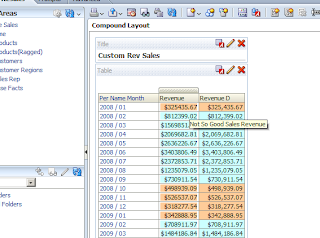
- Click the "Results" tab to show Tooltips as below on the 2nd Column "Revenue" header.

- You can observe that when the mouse is over the blue and orange areas in the 2nd "Revenue" columns, tooltips are show according to the color.


Summary:
As you can see we have created 2 currency columns and for one "Revenue" we had used the custom CASE statement which does our formatting.
for the other "Revenue D" column we have used OBIEE's out-of-the box conditional formatting.
The tooltips feature is not supported on the out-of-box OBIEE hence we had to put that in our CASE statements.
No comments:
Post a Comment